
Table of Contents:
Introduction
Understanding Degree of Operating Leverage
Importance of DOL in Business Decision-making
Real-Life Examples of DOL
4.1 Example 1: Company X’s Expansion Strategy
4.2 Example 2: Impact of Fixed Costs on Company Y’s Profitability
Case Studies on Degree of Operating Leverage
5.1 Case Study 1: Retail Sector’s DOL Analysis
5.2 Case Study 2: Manufacturing Industry and DOL Implications
Calculating and Interpreting DOL
6.1 Formula and Components
6.2 Numerical Examples
Applications of Degree of Operating Leverage
7.1 Financial Planning and Risk Assessment
7.2 Pricing and Product Mix Decisions
7.3 Business Expansion Strategies
Global Perspective: DOL in Different Industries
Indian Context: DOL and its Implications in the Indian Market
Conclusion
Explore 1: Understanding Degree of Operating Leverage
Introduction:
In this section, we will lay the foundation for understanding the Degree of Operating Leverage (DOL) and its significance in business. By grasping the concept of DOL, you’ll be better equipped to comprehend its applications and implications throughout the rest of this blog post.
Understanding Degree of Operating Leverage:
Degree of Operating Leverage (DOL) is a financial metric that measures the sensitivity of a company’s operating income to changes in its sales volume. It provides insights into how a company’s profitability is affected by fluctuations in sales. DOL is particularly useful in assessing the impact of fixed costs on a firm’s profitability.
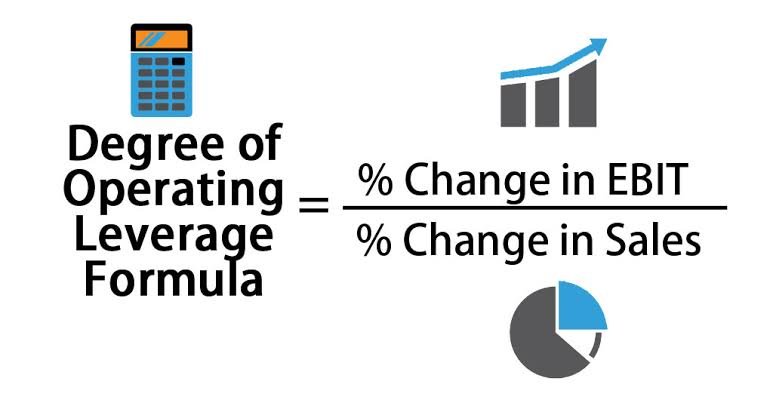
To calculate DOL, we use the following formula:
DOL = (Percentage Change in Operating Income) / (Percentage Change in Sales)
The formula involves comparing the percentage change in operating income to the percentage change in sales. The resulting value indicates the level of operating leverage a company has.
The Importance of DOL in Business Decision-making:
DOL plays a crucial role in making informed business decisions for several reasons:
1. Risk Assessment: DOL helps assess the risk associated with a company’s cost structure. If a company has high fixed costs and low variable costs, it will have a higher DOL. This means that even small changes in sales can lead to significant fluctuations in operating income. Understanding the risk profile enables businesses to plan for potential downturns and make strategic adjustments.
2. Profitability Evaluation: DOL helps evaluate a company’s profitability by analyzing the impact of changes in sales on operating income. Companies with high DOL can experience magnified profit increases during periods of sales growth. Conversely, during a sales decline, their profits can decline more rapidly. Evaluating DOL allows businesses to assess their profit potential and make informed decisions regarding pricing, cost management, and expansion strategies.
3. Strategic Planning: DOL guides strategic planning by providing insights into how changes in sales can affect a company’s financial performance. By understanding the leverage inherent in their cost structure, companies can make informed decisions about resource allocation, capacity planning, and investment strategies. DOL helps businesses identify the optimal balance between fixed and variable costs to maximize profitability and growth potential.
Real-Life Examples of DOL:
To further illustrate the concept of DOL, let’s consider a couple of real-life examples:
Example 1: Company X’s Expansion Strategy
Company X operates a manufacturing facility that produces consumer goods. To expand its market share, Company X decides to invest in new production machinery, increasing its fixed costs significantly. As a result, the company’s DOL increases. During a period of robust sales growth, Company X experiences a substantial increase in operating income. However, during a sales downturn, the impact on profitability is more pronounced due to the higher fixed costs.
Example 2: Impact of Fixed Costs on Company Y’s Profitability
Company Y, a software development firm, has low fixed costs and high variable costs. As a result, the company has a lower DOL. During a period of stagnant sales, Company Y can adjust its variable costs, such as reducing staffing levels or scaling back marketing expenses, to maintain profitability. However, during a sales upswing, the company’s profitability increases at a slower rate compared to a company with higher fixed costs.
By examining these examples, we can observe how DOL influences the relationship between sales volume and operating income. Understanding these dynamics is crucial for effective decision-making and resource allocation within a business.
Conclusion:
In this section, we explored the fundamental concept of Degree of Operating Leverage (DOL) and its significance in business decision-making. By understanding how DOL measures a company’s sensitivity to changes in sales volume, we can better assess risk, evaluate profitability, and make informed strategic decisions. In the following sections, we will delve deeper into real-life case studies, numerical examples, and practical applications of DOL in different business contexts.
Explore 2: Real-Life Examples of DOL
Introduction:
In this section, we will delve into real-life examples that demonstrate the practical implications of the Degree of Operating Leverage (DOL) in different industries and business scenarios. By examining these examples, we can gain a deeper understanding of how DOL affects profitability, risk management, and decision-making processes.
Example 1: Retail Sector’s DOL Analysis
Let’s consider a retail company, Company A, that operates multiple stores across the country. Company A has high fixed costs due to expenses such as rent, utilities, and salaries of store employees. During a period of economic downturn, Company A experiences a decline in sales. As a result, the company’s operating income decreases significantly due to the high fixed costs.
Here, DOL plays a crucial role in assessing the impact of the sales decline on Company A’s profitability. With a high DOL, even a relatively small decrease in sales can lead to a substantial reduction in operating income. This highlights the importance of managing fixed costs efficiently and adopting strategies to mitigate the negative effects of a sales downturn.
Example 2: Manufacturing Industry and DOL Implications
Consider a manufacturing company, Company B, that produces electronic goods. Company B has invested heavily in specialized production equipment, resulting in high fixed costs associated with machinery maintenance and depreciation. During a period of increasing demand for their products, Company B experiences a significant boost in sales.
With a high DOL, the increase in sales results in a substantial rise in operating income. The company benefits from economies of scale and the leverage provided by its fixed-cost investments. This allows Company B to generate higher profits compared to a company with lower operating leverage.
However, during a sales decline, the same high DOL can have adverse effects on Company B’s profitability. The fixed costs become a burden, as they continue to be incurred regardless of the sales volume. Managing costs effectively and implementing strategies to diversify the product portfolio or explore new markets can help mitigate the impact of a sales downturn.
These examples highlight the significance of DOL in various industries. Understanding a company’s DOL enables better risk assessment, profitability evaluation, and strategic planning.
Case Study 1: Retail Company C’s Expansion Strategy
In this case study, we examine how a retail company, Company C, utilizes DOL in its expansion strategy. Company C plans to open new stores in different locations to increase its market presence. However, expanding the retail footprint incurs additional fixed costs, such as rent and salaries.
By analyzing the DOL associated with the expansion, Company C can assess the potential impact on profitability. If the DOL is too high, indicating a significant increase in fixed costs, the company needs to carefully evaluate the expected sales growth and ensure that it justifies the additional costs. By considering the DOL, Company C can make informed decisions about the pace and scale of its expansion, balancing the potential benefits with the associated risks.
Case Study 2: Technology Company D’s Product Mix Decision
In this case study, we explore how a technology company, Company D, uses DOL in making product mix decisions. Company D offers a range of software products, each with different production costs and profit margins. By analyzing the DOL for each product, the company can identify the products with higher leverage and profitability potential.
By allocating resources and focusing on products with higher DOL, Company D can maximize its operating income and overall profitability. Additionally, DOL analysis helps the company identify products with lower leverage, allowing for strategic adjustments such as cost optimization or market positioning to enhance their profitability.
Conclusion:
Real-life examples and case studies demonstrate the practical applications and implications of the Degree of Operating Leverage (DOL) in different business scenarios. Understanding how DOL affects profitability, risk management, and decision-making processes enables companies to make informed choices regarding cost structures, expansion strategies, product mix decisions, and overall financial performance. By leveraging DOL effectively, businesses can optimize their operations, enhance profitability, and navigate the dynamic business landscape successfully.
Explore 3: Calculating and Interpreting DOL
Introduction:
In this section, we will guide you through the process of calculating the Degree of Operating Leverage (DOL) and interpreting the results. By understanding how to calculate DOL and interpret its values, you can gain valuable insights into a company’s cost structure and its sensitivity to changes in sales volume.
Formula and Components:
The formula for calculating DOL is as follows:
DOL = (Percentage Change in Operating Income) / (Percentage Change in Sales)
To calculate DOL, you need two pieces of information: the percentage change in operating income and the percentage change in sales. These values can be obtained by comparing the current period’s financial data with the previous period’s data.
Here are the steps to calculate DOL:
1. Determine the percentage change in operating income:
Percentage Change in Operating Income = ((Operating Income in Current Period – Operating Income in Previous Period) / Operating Income in Previous Period) * 100
2. Determine the percentage change in sales:
Percentage Change in Sales = ((Sales in Current Period – Sales in Previous Period) / Sales in Previous Period) * 100
3. Use the calculated values in the DOL formula:
DOL = (Percentage Change in Operating Income) / (Percentage Change in Sales)
Here’s a numerical example to further illustrate the calculation of Degree of Operating Leverage (DOL):
Company ABC:
Operating Income in Previous Period: $200,000
Operating Income in Current Period: $250,000
Sales in Previous Period: $1,000,000
Sales in Current Period: $1,200,000
To calculate DOL:
Percentage Change in Operating Income = ((250,000 – 200,000) / 200,000) * 100 = 25%
Percentage Change in Sales = ((1,200,000 – 1,000,000) / 1,000,000) * 100 = 20%
DOL = (25% / 20%) = 1.25
In this example, Company ABC has a DOL of 1.25, indicating a higher level of operating leverage. This means that for every 1% increase in sales, the operating income is expected to increase by 1.25%.
By analyzing DOL in this manner, companies can gain insights into the impact of sales changes on operating income and adjust their strategies accordingly.
Interpreting DOL Values:
The interpretation of DOL values depends on the result obtained. Let’s explore the possible scenarios:
1. DOL = 1:
A DOL of 1 indicates that the company’s operating income changes in proportion to changes in sales. In this case, the company has a balanced mix of fixed and variable costs, and the impact on profitability is relatively stable. A DOL of 1 implies a lower level of operating leverage.
2. DOL > 1:
If DOL is greater than 1, it suggests that the company has a higher proportion of fixed costs relative to variable costs. In this scenario, small changes in sales can result in proportionally larger changes in operating income. A higher DOL indicates a higher level of operating leverage, which can amplify both profit growth during sales increases and profit declines during sales decreases.
3. DOL < 1:
If DOL is less than 1, it indicates that the company has a higher proportion of variable costs relative to fixed costs. In this case, changes in sales have a proportionally smaller impact on operating income. A lower DOL suggests a lower level of operating leverage, which means that the company’s profitability is less sensitive to changes in sales volume.
Interpreting DOL values allows businesses to gain insights into their cost structures, risk profiles, and profitability dynamics. Companies with higher DOL need to carefully manage their fixed costs and anticipate the potential impact of sales fluctuations. Conversely, companies with lower DOL have more flexibility in adjusting costs to maintain profitability during periods of sales decline.
Numerical Examples:
To provide a clearer understanding, let’s consider a numerical example:
Company XYZ:
Operating Income in Previous Period: $100,000
Operating Income in Current Period: $130,000
Sales in Previous Period: $500,000
Sales in Current Period: $600,000
Percentage Change in Operating Income = ((130,000 – 100,000) / 100,000) * 100 = 30%
Percentage Change in Sales = ((600,000 – 500,000) / 500,000) * 100 = 20%
DOL = (30% / 20%) = 1.5
In this example, Company XYZ has a DOL of 1.5, indicating a higher level of operating leverage. This means that for every 1% increase in sales, the operating income is expected to increase by 1.5%.
Conclusion:
Calculating the Degree of Operating Leverage (DOL) provides valuable insights into a company’s cost structure and its sensitivity to changes in sales volume. By understanding how to calculate DOL and interpret its values, businesses can evaluate their risk profiles, anticipate profit fluctuations, and make informed decisions regarding cost management, pricing strategies, and expansion plans. DOL serves as a critical financial metric in assessing the impact of sales on a company’s profitability and shaping its overall financial performance.
Explore 4: Applications of Degree of Operating Leverage
Introduction:
In this section, we will explore the practical applications of the Degree of Operating Leverage (DOL) in various aspects of business decision-making. By understanding how DOL can be applied, you can harness its power to optimize financial planning, pricing strategies, and business expansion initiatives.
Financial Planning and Risk Assessment:
DOL plays a crucial role in financial planning and risk assessment. Here are some applications:
1. Sensitivity Analysis: By calculating DOL for different sales scenarios, businesses can assess the impact of sales fluctuations on operating income. This analysis helps identify the level of risk associated with a company’s cost structure and aids in developing contingency plans.
2. Breakeven Analysis: DOL is used to determine the sales volume required to cover fixed costs and reach the breakeven point. Understanding the breakeven sales level assists in setting sales targets and evaluating the feasibility of business ventures.
3. Risk Management: DOL helps businesses evaluate their risk exposure to changes in sales volume. A high DOL indicates higher sensitivity to sales fluctuations, posing greater risks during economic downturns. By identifying the risk factors associated with DOL, companies can develop strategies to mitigate potential losses and protect their profitability.
Pricing and Product Mix Decisions:
DOL provides insights into pricing strategies and product mix decisions. Here’s how it can be applied:
1. Pricing Optimization: By analyzing the DOL for different products or services, businesses can identify those with higher leverage and adjust their pricing accordingly. Products with high DOL can withstand price increases, leading to improved profitability. Conversely, products with low DOL may require competitive pricing to drive sales volume.
2. Product Portfolio Management: DOL helps in evaluating the profitability of different products within a company’s portfolio. By considering the DOL of each product, businesses can make informed decisions about resource allocation, marketing efforts, and product development to maximize overall profitability.
Business Expansion Strategies:
DOL aids in assessing the financial implications of business expansion initiatives. Here are its applications:
1. Expansion Planning: DOL assists in evaluating the financial feasibility of expansion plans by considering the impact on fixed and variable costs. It helps businesses assess the potential increase in sales volume required to cover the additional fixed costs associated with expansion and maintain profitability.
2. Capital Budgeting: DOL analysis helps in capital budgeting decisions by considering the impact of fixed costs on the returns generated by investment projects. It guides businesses in allocating resources to projects with higher leverage and potential for increased profitability.
3. Mergers and Acquisitions: DOL analysis plays a role in evaluating the financial viability and synergies of mergers and acquisitions. It helps in assessing the impact of combining cost structures, identifying potential cost savings, and estimating the post-merger DOL.
By applying DOL in financial planning, pricing strategies, and expansion decisions, businesses can optimize their operations, enhance profitability, and make informed strategic choices.
Conclusion:
The Degree of Operating Leverage (DOL) has numerous applications in business decision-making. From financial planning and risk assessment to pricing strategies and expansion initiatives, DOL provides valuable insights into a company’s cost structure, risk exposure, and potential profitability. By utilizing DOL effectively, businesses can optimize financial performance, make informed pricing decisions, and strategically plan for growth. Understanding the applications of DOL allows companies to navigate market dynamics and make sound decisions that drive sustainable success.
Explore 5: Global Perspective: DOL in Different Industries
Introduction:
In this section, we will explore the global perspective of the Degree of Operating Leverage (DOL) in various industries. By examining how DOL varies across different sectors, we can gain insights into industry-specific dynamics and the implications for business decision-making.
DOL in Manufacturing Industry:
The manufacturing industry often exhibits a higher DOL due to significant fixed costs associated with production facilities, equipment, and labor. Manufacturing companies that heavily invest in specialized machinery or production lines may have higher operating leverage. A small change in sales volume can lead to a more significant impact on operating income. These companies need to carefully manage their fixed costs and maintain a steady flow of orders to ensure profitability.
DOL in Retail and Consumer Goods Industry:
In the retail and consumer goods industry, DOL can vary depending on the business model and product mix. Retailers with a high proportion of fixed costs, such as rent, utilities, and staffing, tend to have a higher DOL. The impact of sales fluctuations on operating income is magnified, making profitability more sensitive to changes in consumer demand. Retailers need to closely monitor their cost structures, optimize inventory management, and adjust pricing strategies to maintain profitability.
DOL in Service Industry:
The service industry typically has a lower DOL compared to manufacturing and retail sectors. Service-based businesses often have lower fixed costs and higher variable costs, such as wages and materials directly tied to the provision of services. Changes in sales volume have a relatively smaller impact on operating income. Service companies can adjust their costs more flexibly in response to changes in demand, allowing them to manage profitability with greater ease.
DOL in Technology and Software Industry:
The technology and software industry can exhibit a wide range of DOL depending on the specific segment. Software companies with high research and development costs and significant upfront investments often have higher fixed costs and higher DOL. These companies experience amplified profit growth during periods of sales increases, but they can also face greater risks during sales declines. On the other hand, technology companies with a focus on recurring revenue models or subscription-based services may have a lower DOL due to the higher proportion of variable costs.
DOL in Financial Services Industry:
The financial services industry, including banking, insurance, and asset management, tends to have a lower DOL compared to other industries. These businesses have lower fixed costs relative to their revenue streams, as their main source of income comes from fees, commissions, and interest spreads. Changes in sales volume have a relatively smaller impact on operating income. However, financial service providers face other risk factors related to market fluctuations, regulatory changes, and interest rate movements.
Conclusion:
The Degree of Operating Leverage (DOL) varies across different industries, reflecting the specific dynamics and cost structures of each sector. Manufacturing companies often exhibit higher DOL due to significant fixed costs associated with production facilities, while service-based businesses tend to have lower DOL. Retailers face higher operating leverage due to fixed costs associated with store operations, while technology and software companies can have varying DOL depending on their business models. Understanding the industry-specific variations in DOL is essential for businesses to make informed decisions regarding cost management, pricing strategies, and risk assessment in their respective sectors.
Explore 6: Indian Context: DOL and its Implications in the Indian Market
Introduction:
In this section, we will explore the specific relevance of the Degree of Operating Leverage (DOL) in the Indian business context. By examining how DOL applies to the Indian market, we can gain insights into the unique dynamics and challenges faced by businesses in India and the implications for decision-making.
Indian Market Characteristics:
The Indian market presents a diverse and rapidly evolving business landscape. Understanding the implications of DOL in the Indian context helps businesses navigate the following key characteristics:
1. Cost Structure: Indian businesses often face challenges related to cost management, particularly with regard to high fixed costs. Infrastructure costs, such as rent and utilities, can be substantial, impacting the DOL. It is essential for companies to carefully assess and manage their fixed costs to maintain profitability.
2. Market Volatility: The Indian market is known for its volatility, influenced by factors such as economic conditions, regulatory changes, and geopolitical factors. Such fluctuations can significantly impact sales volume, affecting the sensitivity of operating income to changes in sales. Analyzing DOL helps companies evaluate their risk exposure and devise strategies to mitigate the impact of market volatility.
3. Price Sensitivity: Price sensitivity is a crucial factor in the Indian market, with consumers often seeking value-for-money products and services. Companies need to consider the impact of pricing decisions on sales volume and operating income. DOL analysis helps determine the optimal pricing strategy to maintain profitability while remaining competitive in the market.
Implications of DOL in the Indian Market:
Understanding DOL’s implications in the Indian market provides valuable insights for business decision-making:
1. Expansion Strategies: Indian businesses considering expansion need to assess the DOL implications. Expanding operations incurs additional fixed costs, and companies must evaluate the potential increase in sales volume required to cover these costs and maintain profitability. Market research and understanding customer behavior are essential in identifying growth opportunities with the appropriate DOL considerations.
2. Start-ups and Scaling: Start-ups in India often face unique challenges due to limited resources and cost management. Analyzing DOL helps start-ups make informed decisions regarding cost structures, pricing strategies, and growth plans. It aids in determining the point at which scale is achieved, allowing businesses to optimize their operations and maximize profitability.
3. Pricing and Competitive Strategies: With price sensitivity being a significant factor in the Indian market, DOL analysis assists in pricing decisions. By understanding the cost structure and DOL, businesses can set competitive prices while maintaining profitability. Companies need to strike a balance between attracting customers with competitive pricing and ensuring that the impact on operating income remains favorable.
4. Government Policies and Regulations: The Indian market is influenced by government policies and regulations that can impact business operations and cost structures. Companies must assess the DOL implications of regulatory changes and adapt their strategies accordingly. By monitoring policy developments and considering their impact on fixed and variable costs, businesses can proactively manage their operating leverage.
Conclusion:
The Degree of Operating Leverage (DOL) holds specific implications in the Indian business context, considering the market characteristics, cost structures, and regulatory environment. Analyzing DOL helps Indian businesses make informed decisions regarding expansion strategies, pricing and competitive positioning, cost management, and risk assessment. By understanding the unique dynamics of the Indian market and applying DOL effectively, businesses can navigate challenges, optimize financial performance, and seize growth opportunities in this dynamic and rapidly evolving business landscape.
Explore 7: Conclusion
In this blog post, we explored the concept of the Degree of Operating Leverage (DOL) and its significance in the business world, both globally and in the Indian context. By understanding DOL and its applications, businesses can make informed decisions regarding cost structures, pricing strategies, expansion plans, and financial performance optimization.
We started by understanding DOL and its formula, which measures the sensitivity of a company’s operating income to changes in sales volume. We discussed how to calculate DOL using the percentage change in operating income and sales, and how to interpret the results.
Real-life examples and case studies provided practical insights into how DOL affects profitability, risk management, and decision-making processes. We explored scenarios in different industries such as retail, manufacturing, technology, and services, highlighting the varying levels of operating leverage and their implications.
The applications of DOL were then discussed, covering areas such as financial planning and risk assessment, pricing and product mix decisions, and business expansion strategies. We emphasized how DOL aids in evaluating risk exposure, optimizing pricing strategies, and making strategic decisions based on cost structures and market dynamics.
We also explored the global perspective of DOL, understanding how it varies across different industries and their specific dynamics. Additionally, we examined the relevance of DOL in the Indian market, considering factors such as cost structures, market volatility, price sensitivity, and government policies. The Indian context highlighted the need for effective cost management, strategic pricing decisions, and careful expansion planning.
By applying DOL effectively, businesses can optimize financial performance, manage risk, and make informed decisions to thrive in their respective industries. Understanding DOL empowers companies to assess profitability, evaluate risk profiles, and strategically plan for growth in a dynamic and competitive business landscape.
In conclusion, the Degree of Operating Leverage (DOL) is a powerful financial metric that provides insights into a company’s cost structure, risk exposure, and profitability dynamics. By leveraging DOL effectively, businesses can make informed decisions, mitigate risk, and seize opportunities for sustainable growth and success.

Leave a comment