Index:
1. Introduction
2. Financial Break-Even Point
2.1 Definition and Concept
2.2 Calculation Methodology
2.3 Real-Life Examples
2.4 Case Studies
2.5 Applications in the World Context
2.6 Applications in the Indian Context
3. Indifference Curves
3.1 Definition and Concept
3.2 Understanding Indifference Curves
3.3 Real-Life Examples
3.4 Case Studies
3.5 Numerical Illustrations
3.6 Applications in the World Context
3.7 Applications in the Indian Context
4. Financial Break-Even Point vs. Indifference Curves: A Critical Analysis
5. Conclusion
**Financial Break-Even Point:**
1. Definition and Concept:
The financial break-even point is a crucial metric used to determine the level of sales or revenue required for a business to cover all its costs and achieve a zero-profit position. It is the point where total revenue equals total costs, and the business neither makes a profit nor incurs a loss. This point is significant for businesses as it helps assess the minimum level of sales needed to cover fixed and variable costs.
2. Calculation Methodology:
There are several methods to calculate the financial break-even point:
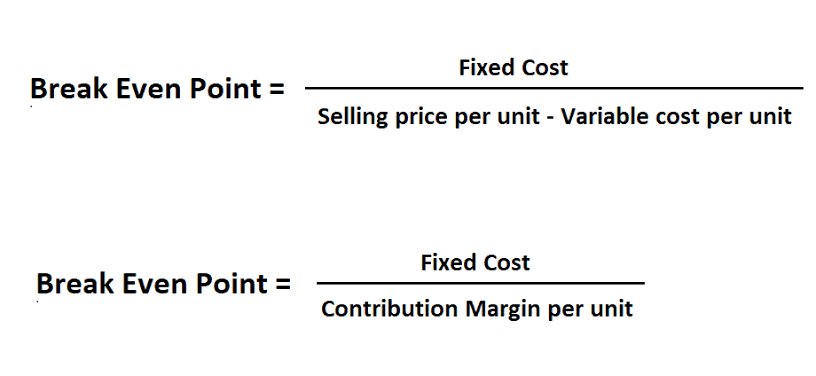
– Equation Approach: This approach involves using a simple equation to calculate the break-even point. The formula is: Break-Even Point = Fixed Costs / (Selling Price per Unit – Variable Costs per Unit).
– Contribution Margin Approach: The contribution margin is the difference between selling price per unit and variable costs per unit. The break-even point can be calculated by dividing the fixed costs by the contribution margin ratio.
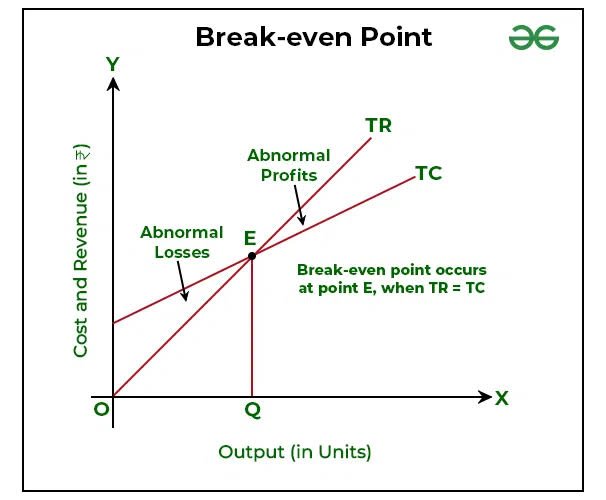
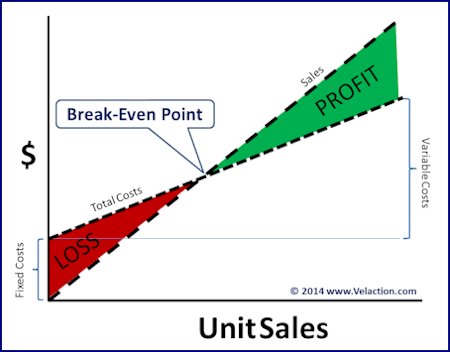
– Graphical Approach: A graphical representation of costs and revenue is used to identify the break-even point. The point where the total cost and total revenue lines intersect represents the break-even point.
3. Real-Life Examples:
To illustrate the concept of financial break-even point, let’s consider the example of a manufacturing company that produces and sells smartphones. The fixed costs include rent, salaries, and utilities, while the variable costs include raw materials, labor, and packaging. By calculating the break-even point, the company can determine the minimum number of smartphones it needs to sell to cover all costs.
4. Case Studies:
One case study could focus on a startup in the hospitality industry. The case study would analyze the fixed and variable costs associated with opening a new restaurant and calculate the break-even point in terms of the number of customers or meals served. This would provide insights into the financial viability of the venture.
5. Applications in the World Context:
The financial break-even point concept is widely applicable across various industries globally. For instance, in the airline industry, airlines must determine the number of passengers they need to transport to cover their operating costs. Similarly, in the software industry, companies need to calculate the number of software licenses they need to sell to reach the break-even point.
6. Applications in the Indian Context:
In the Indian context, the financial break-even point is vital for businesses in different sectors. For example, in the retail sector, companies need to determine the minimum sales volume required to cover expenses such as rent, salaries, and inventory costs. Understanding the break-even point helps businesses set realistic sales targets and make informed decisions.
**Indifference Curves:**
2.1 Definition and Concept:
Indifference curves are graphical representations used in economics to depict an individual’s preferences and trade-offs between different combinations of goods or services. They represent a set of combinations of two goods that provide the same level of satisfaction or utility to the individual. The concept of indifference curves helps economists understand consumer behavior and decision-making.
2.2 Understanding Indifference Curves:
Indifference curves have the following characteristics:
– They slope downward from left to right, indicating the negative relationship between the two goods.
– Higher indifference curves represent higher levels of utility or satisfaction.
– Indifference curves are convex to the origin, reflecting the concept of diminishing marginal utility.
2.3 Real-Life Examples:
To understand indifference curves, let’s consider an example of a consumer choosing between two goods: pizza and soda. Indifference curves can represent different combinations of pizzas and sodas that provide the same level of satisfaction to the consumer. For instance, an individual might be equally satisfied with two pizzas and three sodas or four pizzas and one soda.
2.4 Case Studies:
A case study could focus on consumer preferences in the automobile industry. It would analyze the trade-offs individuals make when choosing between factors such as price, fuel efficiency, and safety features. By examining indifference curves, the study could highlight the preferences and priorities of consumers in making car purchase decisions.
2.5 Numerical Illustrations:
To illustrate indifference curves numerically, we can consider a scenario where an individual allocates their income between two goods: books and movies. By assigning different values to the quantity of books and movies, we can construct an indifference curve, showcasing various combinations that provide the same level of utility.
2.6 Applications in the World Context:
Indifference curves have practical applications in various economic scenarios worldwide. For example, when analyzing the impact of changes in income or prices, economists use indifference curves to predict consumer responses and understand how preferences change.
2.7 Applications in the Indian Context:
Indifference curves are also relevant in the Indian economy. For instance, understanding consumer preferences in the mobile phone market can help companies design products that align with customers’ preferences for features, price points, and brand reputation.
By combining the concepts of financial break-even point and indifference curves, businesses can make informed decisions about pricing, production levels, and marketing strategies to maximize profitability while considering consumer preferences.
**Real-Life Case Studies:**
1. Case Study: Restaurant Break-Even Analysis
– Description: A case study focusing on a new restaurant opening in a competitive market.
– Details: The case study examines the fixed and variable costs involved in setting up and running the restaurant, such as rent, utilities, staffing, ingredients, and marketing expenses. It analyzes the break-even point in terms of the number of customers or meals served and explores strategies to reach profitability.
2. Case Study: Manufacturing Company Expansion
– Description: A case study of a manufacturing company considering expansion into a new product line.
– Details: The case study analyzes the fixed costs associated with purchasing new machinery, hiring additional staff, and marketing the new product. By calculating the break-even point and considering market demand and pricing strategies, the company can evaluate the feasibility of the expansion and determine the sales volume needed to cover costs.
**Real-Life Examples:**
1. Retail Business Break-Even Point
– Example: A retail clothing store with fixed costs like rent, salaries, and inventory expenses.
– Details: By calculating the break-even point, the store can determine the minimum sales volume required to cover fixed costs. For example, if the total fixed costs are $10,000 per month and the contribution margin per unit is $20, the break-even point would be 500 units. Any sales volume above 500 units would result in a profit.
2. Startup Tech Company Break-Even Point
– Example: A technology startup developing a new software product.
– Details: The startup needs to calculate the break-even point in terms of the number of software licenses it must sell to cover its fixed costs, such as software development, marketing, and operational expenses. By considering the pricing strategy and variable costs per license, the break-even point can be determined.
**Numerical Illustrations:**
1. Indifference Curves and Consumer Preferences
– Example: A numerical illustration of an individual’s preferences between two goods: coffee and tea.
– Details: By assigning different levels of satisfaction or utility to various combinations of coffee and tea, an indifference curve can be constructed. For instance, if an individual receives the same level of satisfaction from four cups of coffee and two cups of tea, the indifference curve would represent this combination.
2. Financial Break-Even Point Calculation
– Example: A numerical example of a small business calculating the break-even point.
– Details: Considering the fixed costs (e.g., $10,000) and the contribution margin per unit (e.g., $20), the break-even point can be calculated as $10,000 / $20 = 500 units. This means the business needs to sell at least 500 units to cover all fixed and variable costs and reach the break-even point.
3. Indifference Curves:
3.1 Definition and Concept:
– Indifference curves: Graphical representations used in economics to depict an individual’s preferences and trade-offs between different combinations of goods or services. They represent a set of combinations of two goods that provide the same level of satisfaction or utility to the individual.
3.2 Understanding Indifference Curves:
– Indifference curves slope downward from left to right, indicating the negative relationship between the two goods.
– Higher indifference curves represent higher levels of utility or satisfaction.
– Indifference curves are convex to the origin, reflecting the concept of diminishing marginal utility.
3.3 Real-Life Examples:
– Example: A consumer choosing between two goods: pizza and soda.
– Details: Indifference curves can represent different combinations of pizzas and sodas that provide the same level of satisfaction to the consumer. For instance, an individual might be equally satisfied with two pizzas and three sodas or four pizzas and one soda.
3.4 Case Studies:
– Case Study: Consumer preferences in the automobile industry.
– Details: This case study analyzes the trade-offs individuals make when choosing between factors such as price, fuel efficiency, and safety features. By examining indifference curves, the study highlights the preferences and priorities of consumers in making car purchase decisions.
3.5 Numerical Illustrations:
– Numerical Illustration: Allocation of income between books and movies.
– Details: This illustration considers a scenario where an individual allocates their income between two goods: books and movies. By assigning different values to the quantity of books and movies, an indifference curve can be constructed, showcasing various combinations that provide the same level of utility.
3.6 Applications in the World Context:
– Example: Impact of changes in income or prices.
– Details: Indifference curves are used to predict consumer responses and understand how preferences change when analyzing the impact of changes in income or prices. Economists can use indifference curves to study consumer behavior and predict market demand.
3.7 Applications in the Indian Context:
– Example: Consumer preferences in the mobile phone market.
– Details: Understanding consumer preferences in the Indian context helps companies design products that align with customers’ preferences for features, price points, and brand reputation. Indifference curves aid in understanding the trade-offs consumers make when choosing between different mobile phone models.
4. Financial Break-Even Point vs. Indifference Curves: A Critical Analysis:
This section aims to provide a critical analysis of the similarities, differences, and interplay between financial break-even points and indifference curves. It highlights the practical implications of these concepts in decision-making processes.
– Similarities:
– Both financial break-even points and indifference curves are tools used in economic analysis.
– They involve trade-offs and decision-making processes.
– They provide insights into the profitability and utility of different choices or decisions.
– Differences:
– Financial break-even points focus on costs, revenues, and profit maximization in business contexts, while indifference curves focus on individual preferences and utility maximization.
– Financial break-even points are quantitative metrics that involve calculations and numerical analysis, while indifference curves are graphical representations of preferences.
– Financial break-even points primarily relate to business operations, while indifference curves are more broadly applicable to consumer choices and economic decision-making.
– Interplay:
– Financial break-even analysis can be complemented by considering consumer preferences represented by indifference curves. Understanding consumer preferences helps businesses make informed decisions regarding product pricing, features, and marketing strategies.
– By analyzing indifference curves, businesses can identify market segments and target specific consumer preferences, which can influence pricing strategies and sales volume needed to achieve financial break-even points.
– The interplay between financial break-even points and indifference curves allows businesses to align their operations and strategies with consumer preferences to achieve profitability and customer satisfaction.
The critical analysis presented in this section highlights the practical implications of both financial break-even points and indifference curves and emphasizes the importance of considering both factors in decision-making processes.
Conclusion:
In this comprehensive guide, we have explored two essential concepts in the field of finance and economics: the financial break-even point and indifference curves. We have examined their definitions, calculation methodologies, real-life examples, case studies, and practical applications in both global and Indian contexts. Additionally, we have provided a critical analysis of the similarities, differences, and interplay between these concepts.
The financial break-even point serves as a vital metric for businesses to determine the sales volume or revenue required to cover all costs and achieve a zero-profit position. It helps businesses assess their viability and profitability, make informed pricing and production decisions, and set realistic sales targets. Through real-life examples and case studies, we have illustrated how businesses in different industries calculate and utilize the financial break-even point.
On the other hand, indifference curves provide insights into individual preferences and decision-making in the consumption of goods and services. They depict the trade-offs individuals make when choosing between different combinations of goods. By understanding indifference curves, businesses can better understand consumer behavior, design products or services that align with customer preferences, and make strategic decisions regarding pricing, features, and marketing.
Through a critical analysis, we have highlighted the interplay between financial break-even points and indifference curves. Businesses can leverage consumer preferences represented by indifference curves to inform their strategies for reaching the financial break-even point. By aligning their operations and offerings with consumer preferences, businesses can increase the likelihood of achieving profitability and customer satisfaction.
In conclusion, the financial break-even point and indifference curves are valuable tools in decision-making processes. By considering both financial considerations and consumer preferences, businesses can make informed decisions that optimize profitability and meet customer needs. Understanding these concepts and their practical implications is essential for businesses operating in diverse industries and market contexts.
Incorporating the key insights and learnings from this guide, businesses and individuals can enhance their decision-making processes, maximize profitability, and better understand the dynamics of consumer behavior.
Thank you for joining us on this exploration of financial break-even points and indifference curves.

Leave a comment