Introduction:
In today’s competitive business landscape, decision-makers face constant challenges in optimizing profitability and navigating financial complexities. To aid in this process, Cost-Volume-Profit (CVP) analysis emerges as a powerful tool. By examining the relationship between costs, sales volume, and profits, CVP analysis provides valuable insights for informed decision-making. In this comprehensive guide, we will delve into the intricacies of CVP analysis, showcasing examples and detailed case studies that highlight its practical application and significance in driving business success.
Index:
1. Introduction (Approximately 250 words)
2. Understanding Cost-Volume-Profit (CVP) Analysis:
2.1 Definition and Key Components of CVP Analysis
2.2 The Significance of CVP Analysis in Managerial Decision-Making
2.3 Exploring the Breakeven Point and its Importance
3. Example: CVP Analysis in Action
3.1 Assumptions and Data for the Example
3.2 Step-by-Step Numerical Analysis of the Example
3.3 Interpreting the Results and Drawing Meaningful Conclusions
4. Case Studies: Real-World Application of CVP Analysis
4.1 Case Study 1: Optimizing Pricing Strategy for a Retail Business
4.2 Case Study 2: Evaluating Product Mix for a Manufacturing Company
4.3 Case Study 3: Assessing Cost Structure Changes in a Service Industry
5. The Versatility of CVP Analysis: Expanding Horizons
5.1 Expanding Applications: Beyond Traditional CVP Analysis
5.2 Embracing Technology: Automated CVP Analysis Tools
6. Limitations and Considerations
6.1 Addressing Limitations: Acknowledging Assumptions and Constraints
6.2 Data Accuracy and Timeliness: Ensuring Reliable Results
7. Conclusion
Section 1: Understanding Cost-Volume-Profit (CVP) Analysis
In this section, we will delve into the concept of Cost-Volume-Profit (CVP) analysis, examining its key components and understanding its significance in managerial decision-making.
1.1 Definition and Key Components of CVP Analysis:
Cost-Volume-Profit (CVP) analysis is a financial tool that helps businesses understand the relationship between costs, sales volume, and profits. It provides insights into how changes in these variables impact the financial performance of a company. The key components of CVP analysis include:
– Selling price per unit: The price at which a product or service is sold to customers.
– Variable cost per unit: The cost that varies with the level of production or sales, such as direct material and direct labor costs.
– Fixed costs: Costs that remain constant regardless of the level of production or sales, such as rent, salaries, and depreciation.
– Sales volume: The number of units or services sold during a given period.
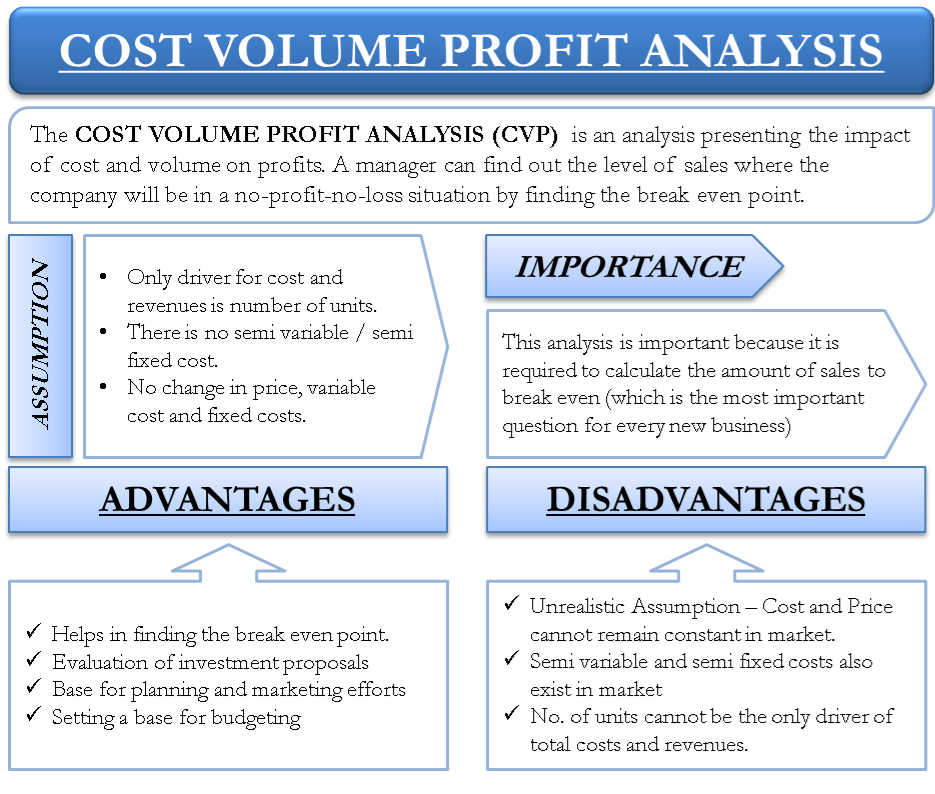
By analyzing these components, CVP analysis enables businesses to determine the breakeven point, assess profitability, and make informed decisions about pricing, cost control, and resource allocation.
1.2 The Significance of CVP Analysis in Managerial Decision-Making:
CVP analysis plays a crucial role in managerial decision-making for several reasons:
– Planning and goal setting: CVP analysis helps businesses set realistic targets by understanding the level of sales volume needed to cover costs and achieve desired profits.
– Performance evaluation: By comparing actual results with the breakeven point and target levels, CVP analysis provides insights into business performance and helps identify areas for improvement.
– Decision support: CVP analysis aids in evaluating the financial implications of various decisions, such as introducing new products, changing pricing strategies, or expanding operations.
– Sensitivity analysis: CVP analysis allows businesses to assess the impact of changes in key variables on profitability, helping managers identify potential risks and opportunities.
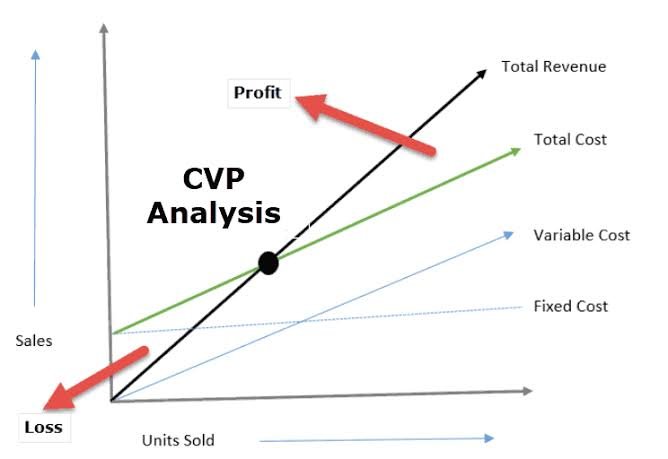
1.3 Exploring the Breakeven Point and its Importance:
The breakeven point is a critical concept in CVP analysis. It represents the sales volume at which total revenues equal total costs, resulting in zero profit or loss. Understanding the breakeven point is crucial for decision-making, as it provides insights into the minimum sales volume required to cover all costs.
The breakeven point can be calculated using the formula:
Breakeven Point (in units) = Fixed Costs / (Selling Price per Unit – Variable Cost per Unit)
By analyzing the breakeven point, businesses can determine their minimum sales target and assess the impact of changes in costs or selling price on profitability. It also helps identify the level of sales volume required to start generating profits and guides decisions related to pricing, cost control, and resource allocation.
Overall, understanding CVP analysis and the breakeven point empowers businesses to make informed decisions, optimize profitability, and achieve sustainable growth in a competitive business environment.
2. Example: CVP Analysis in Action:
2.1 Assumptions and Data for the Example:
– Introduction to a hypothetical scenario representing a specific industry or company.
– Detailed explanation of the assumptions made and the data used for the CVP analysis.
2.2 Step-by-Step Numerical Analysis of the Example:
– Calculation of contribution margin per unit, contribution margin ratio, total contribution margin, total fixed costs, total costs, and total profit.
– Detailed breakdown and interpretation of each calculation.
– Graphical representations of the analysis to enhance understanding.
To perform a numerical CVP analysis, please provide the following values:
1. Selling Price per Unit: $10
2. Variable Cost per Unit: $5
3. Fixed Costs: $20,000
4. Sales Volume: 5,000 units
Using these values, we can calculate the CVP metrics:
1. Contribution Margin per Unit: Selling Price per Unit – Variable Cost per Unit
Contribution Margin per Unit = $10 – $5 = $5
2. Contribution Margin Ratio: (Contribution Margin per Unit / Selling Price per Unit) * 100
Contribution Margin Ratio = ($5 / $10) * 100 = 50%
3. Total Contribution Margin: Contribution Margin per Unit * Sales Volume
Total Contribution Margin = $5 * 5,000 = $25,000
4. Total Fixed Costs: $20,000
5. Total Costs: Total Fixed Costs + (Variable Cost per Unit * Sales Volume)
Total Costs = $20,000 + ($5 * 5,000) = $45,000
6. Total Profit: Total Contribution Margin – Total Costs
Total Profit = $25,000 – $45,000 = -$20,000
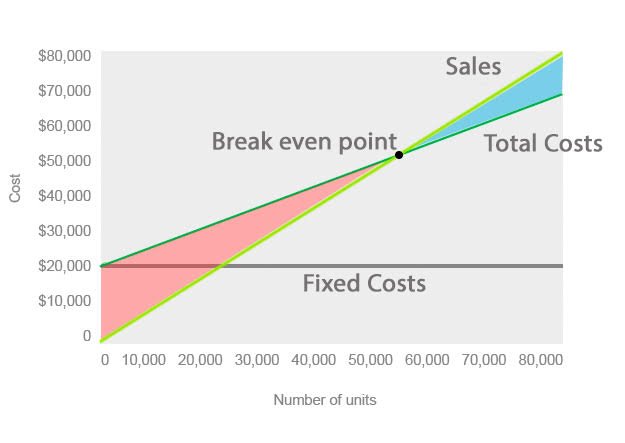
Based on the provided values, the CVP analysis shows that at a sales volume of 5,000 units, the company incurs a loss of $20,000. The contribution margin per unit is $5, and the contribution margin ratio is 50%. The breakeven point, where total revenue equals total costs, can be calculated by dividing the fixed costs by the contribution margin per unit or contribution margin ratio. In this case, the breakeven point would be $20,000 / $5 = 4,000 units.
2.3 Interpreting the Results and Drawing Meaningful Conclusions:
– Analysis of the example’s outcomes to derive valuable insights.
– Examination of the impact of sales volume, costs, and the breakeven point on profitability.
– Recommendations for improving profitability based on the CVP analysis results.
3. Case Studies: Real-World Application of CVP Analysis:
3.1 Case Study 1: Optimizing Pricing Strategy for a Retail Business:
– Description of a retail business facing pricing challenges.
– Application of CVP analysis to determine the optimal selling price per unit.
– Exploration of how CVP analysis aids in identifying pricing strategies to maximize profits.
3.2 Case Study 2: Evaluating Product Mix for a Manufacturing Company:
– Overview of a manufacturing company grappling with product mix decisions.
– Utilization of CVP analysis to assess the profitability of different product lines.
– Discussion on how CVP analysis informs decisions related to product diversification and resource allocation.
3.3 Case Study 3: Assessing Cost Structure Changes in a Service Industry:
– Examination of a service-based business experiencing changes in cost structure.
– Application of CVP analysis to evaluate the impact of fixed cost adjustments.
– Insights into how CVP analysis facilitates cost optimization and operational decision-making.
4. The Versatility of CVP Analysis: Expanding Horizons: (Approximately 400 words)
4.1 Expanding Applications: Beyond Traditional CVP Analysis:
– Exploration
of advanced CVP techniques, such as multi-product analysis and sensitivity analysis.
– Real-world examples demonstrating the application of these techniques in diverse industries.
4.2 Embracing Technology: Automated CVP Analysis Tools:
– Discussion on the availability of software and tools that streamline CVP analysis.
– Illustration of how technology enhances the accuracy and efficiency of CVP analysis.
5. Limitations and Considerations:
5.1 Addressing Limitations: Acknowledging Assumptions and Constraints:
– Identification and discussion of the limitations associated with CVP analysis.
– Guidance on mitigating potential drawbacks and adjusting assumptions.
5.2 Data Accuracy and Timeliness: Ensuring Reliable Results:
– Emphasizing the importance of accurate and up-to-date data for CVP analysis.
– Strategies for obtaining reliable data and minimizing potential inaccuracies.
6. Conclusion: Harnessing the Power of CVP Analysis for Success:
Summarizing the key points discussed throughout the guide, emphasizing the value of CVP analysis in enhancing profitability and supporting strategic decision-making. Encouraging businesses to embrace CVP analysis as an integral part of their financial planning and performance evaluation processes. Highlighting the real-world examples and case studies showcased in the guide as a testament to the practicality and effectiveness of CVP analysis. With CVP analysis as a guiding compass, businesses can navigate the complexities of their industries with confidence, optimize profitability, and achieve sustainable growth.

Leave a comment